MARKET TRENDS
Epoxy Resins and PUR Lead Biobased Polymer Use in Functional Applications
Combined, these two polymers represent over 40% of total biobased production and are key to performance-based markets like adhesives and construction.
By Karen Parker, Editor-in-Chief, ASI
Demand Grows for Additives in EV Adhesives and Sealants as Consumers go Electric
With continued demand for adhesives and sealants used in the production of EVs, there is also growth in the raw materials used to manufacture those adhesives.
As industries shift toward sustainability, the demand for environmentally responsible adhesives and sealants is increasing — driven by regulatory pressures, end-user expectations, and corporate initiatives. As demand grows, manufacturers are seeking materials that reduce carbon footprints without compromising performance. Biobased polymers, which can form the backbone of modern adhesive and sealant formulations, are poised as alternatives to fossil-derived inputs. The latest market report from nova-Institute sheds light on the state of biobased polymers in 2024.
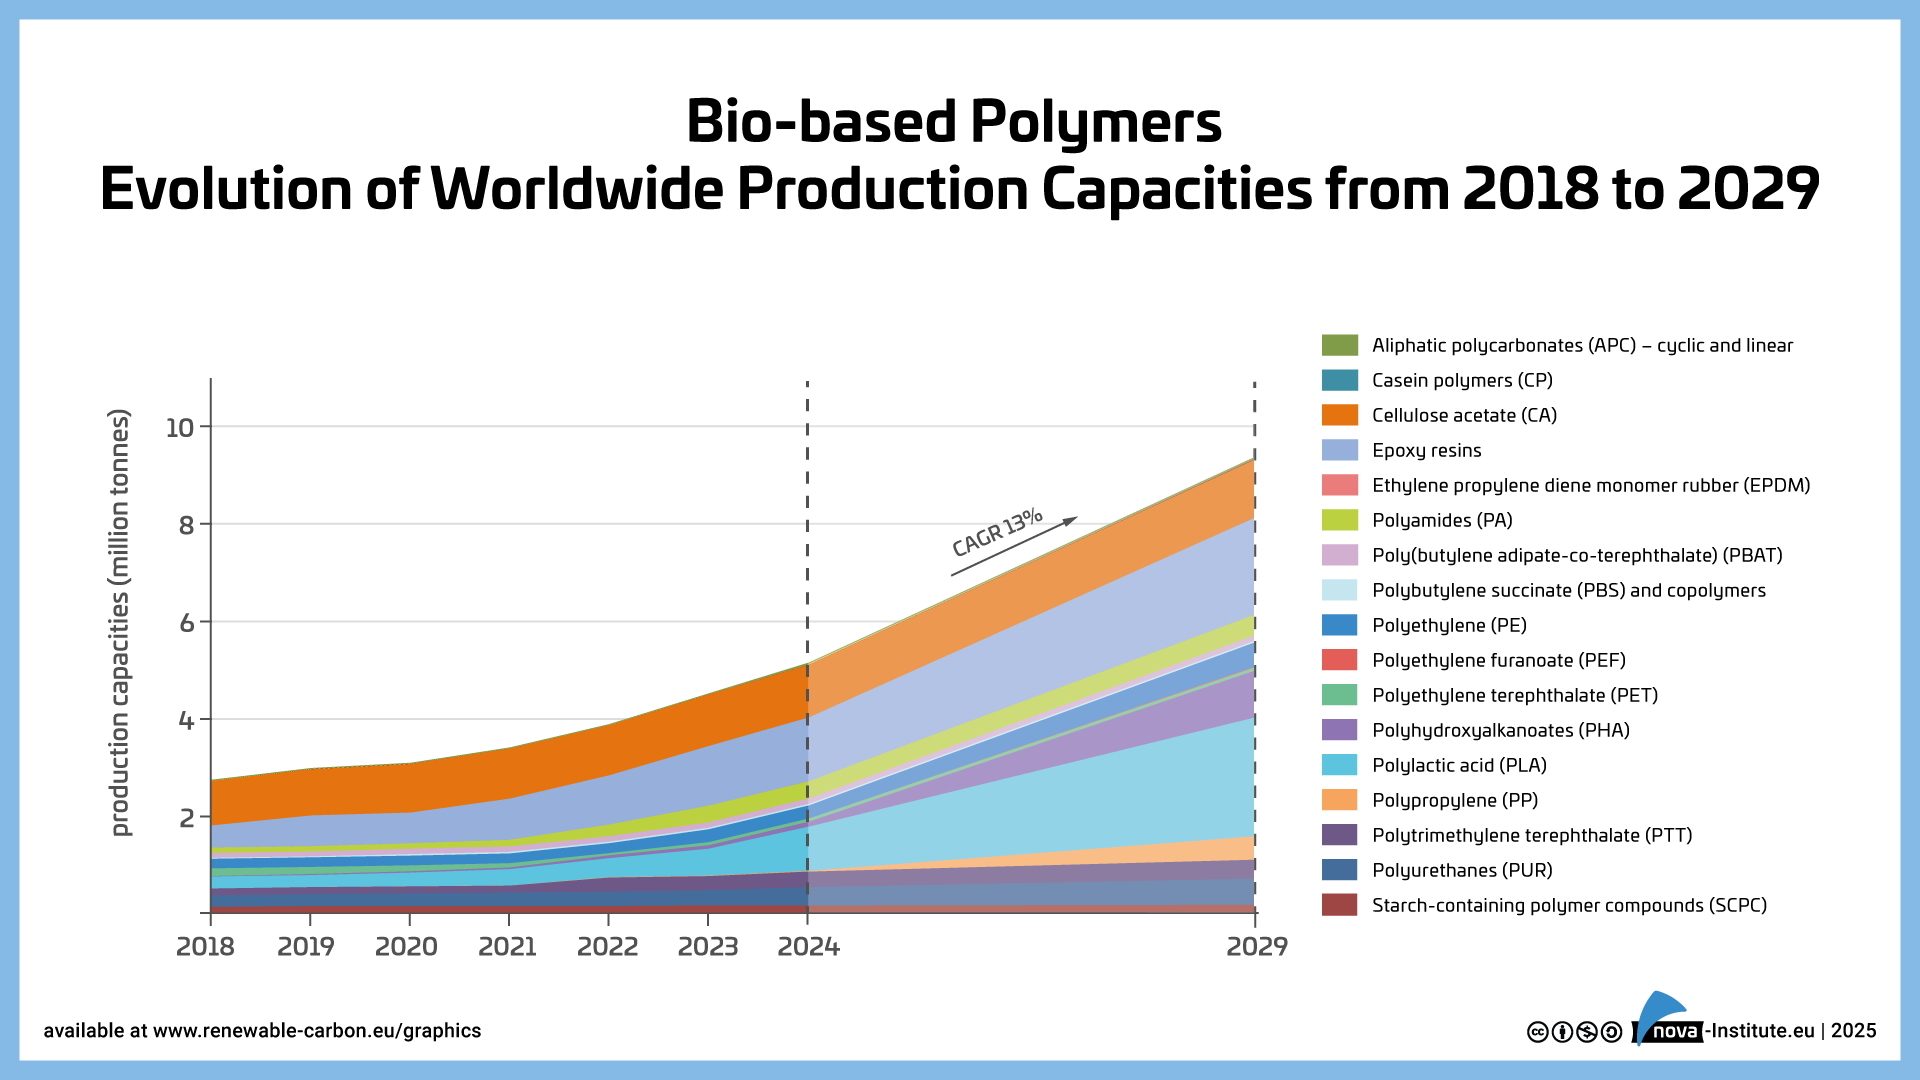
The study released by nova-Institute reports that 2024 was a respectable year for biobased polymers, with an overall expected compound annual growth rate (CAGR) of 13% to 2029. Overall, biobased biodegradable polymers have large installed capacities with an expected CAGR of 17% to 2029, but the current average capacity utilization is moderate at 65%. In contrast, biobased non-biodegradable polymers have a much higher utilization rate of 90% but will only grow by 10% to 2029.
Epoxy resin and PUR production is growing moderately at 9% and 8%, respectively, while PP and cyclic APC capacities are increasing by 30%. Despite a decline in production of biodegradables, especially for PLA in Asia, capacities have increased by 40%. The same applies to PHA capacities. Commercial newcomers such as casein polymers and PEF recorded a rise in production capacity and are expected to continue to grow significantly until 2029.
Additionally, the total production volume of biobased polymers has been 4.2 million tonnes in 2024, which is 1% of the total production volume of fossil-based polymers, and the CAGR of biobased polymers is, with 13%, significantly higher than the overall growth of polymers (2–3%). This development is expected to continue until 2029. With these growth rates, the share of biobased polymers will increase up to 2%.
Of the total 4.2 million tonnes of biobased polymers produced in 2024, cellulose acetate (CA), with a biobased content of 50%, and epoxy resins, with a biobased content of 45%, account for more than half of the biobased production, 26% and 32%, respectively. This is followed by 30% biobased polyurethanes (PUR) with 9%, 100% biobased polylactic acid (PLA) with 8%, polyamides (PA) (60% biobased content) with 7%, and polytrimethylene terephthalate (PTT) (31% biobased content) with 6%. (Figure 1). The share of aliphatic polycarbonates (APC; circular and linear), poly(butylene adipate-co-terephthalate) (PBAT), polyethylene (PE), polyethylene terephthalate (PET), polyhydroxyalkanoates (PHA) and starch-containing polymer compounds (SCPC) was less than 5%. Casein polymers (CP), ethylene propylene diene monomer rubber (EPDM), polybutylene succinate (PBS), polyethylene furanoate (PEF) and polypropylene (PP) accounted for less than 1% of the total bio-based polymer production volume and are not shown.
Figure 1: Biobased polymer capacities and production worldwide 2024.
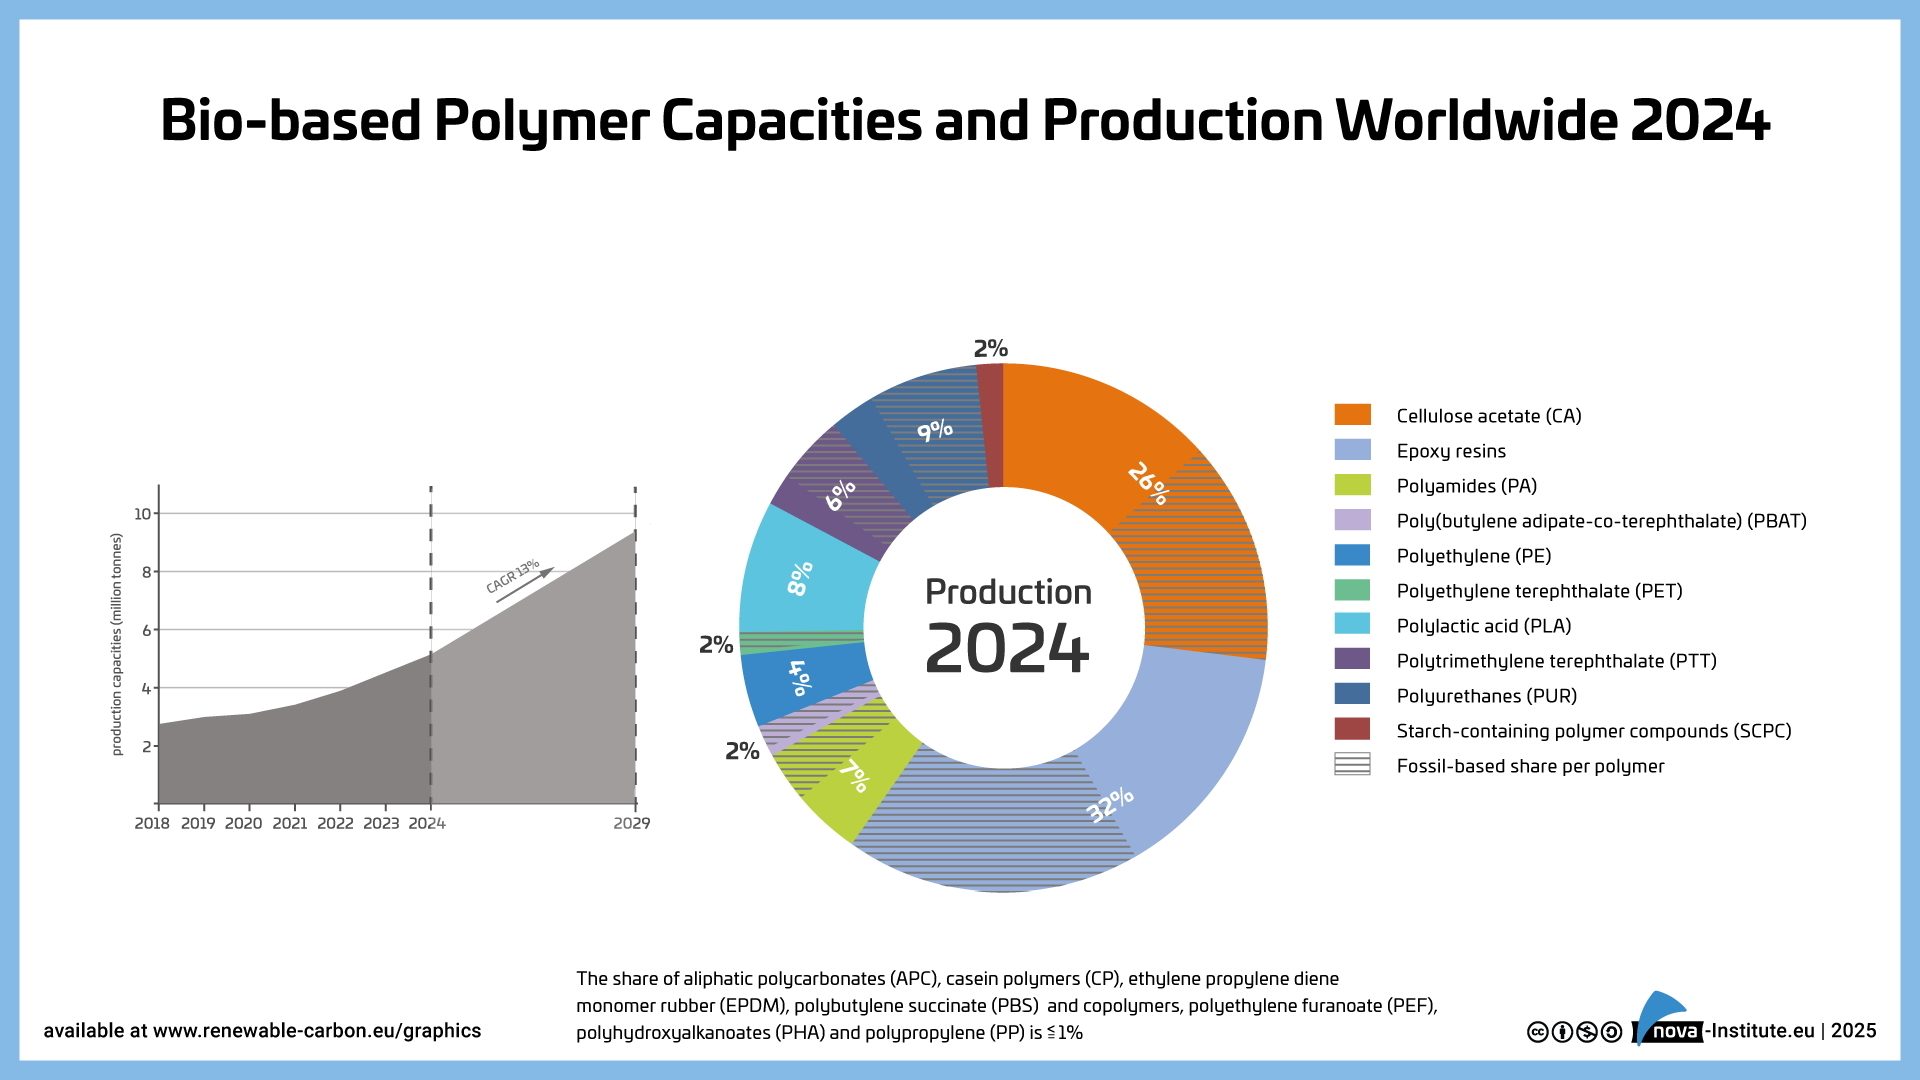
The increase in production capacity from 2023 to 2024 is mainly due to the expansion of PLA capacity and epoxy resin production in Asia, as well as a global increase in PUR production. Also, Asian expansions for PHA and PTT were already included in the report from 2024. PP, PHA, and PEF are particularly expected to grow continuously by 65% on average until 2029. While PHA capacities will increase mainly in Asia and PEF in Asia and in Europe, PP capacities will increase mainly in North America.
Demand for Feedstock and Land Use
Considering the steadily increasing demand for biobased polymers, the need for biomass feedstocks should be considered as an important factor. This is particularly true for the recurring debate on the use of food crops for the production of these polymers. The total demand for biomass was 13.6 billion tonnes for feed, bioenergy, food, material use, and biofuels as well as biobased polymers. While the majority of biomass (56%) is used for feed production, only 0.023% is required for the production of biobased polymers (Figure 2). This results in a biomass feedstock demand of 3.2 million tonnes for the production of 4.2 million tonnes of biobased polymers and reflects a land use share of only 0.013%. This is due to the fact that the main feedstocks used in the production of bio-based polymers are sugars (25%) and starch (20%), which are obtained from high-yield crops such as sugar cane and maize, resulting in a high area efficiency.
Figure 2: Biomass utilization worldwide.
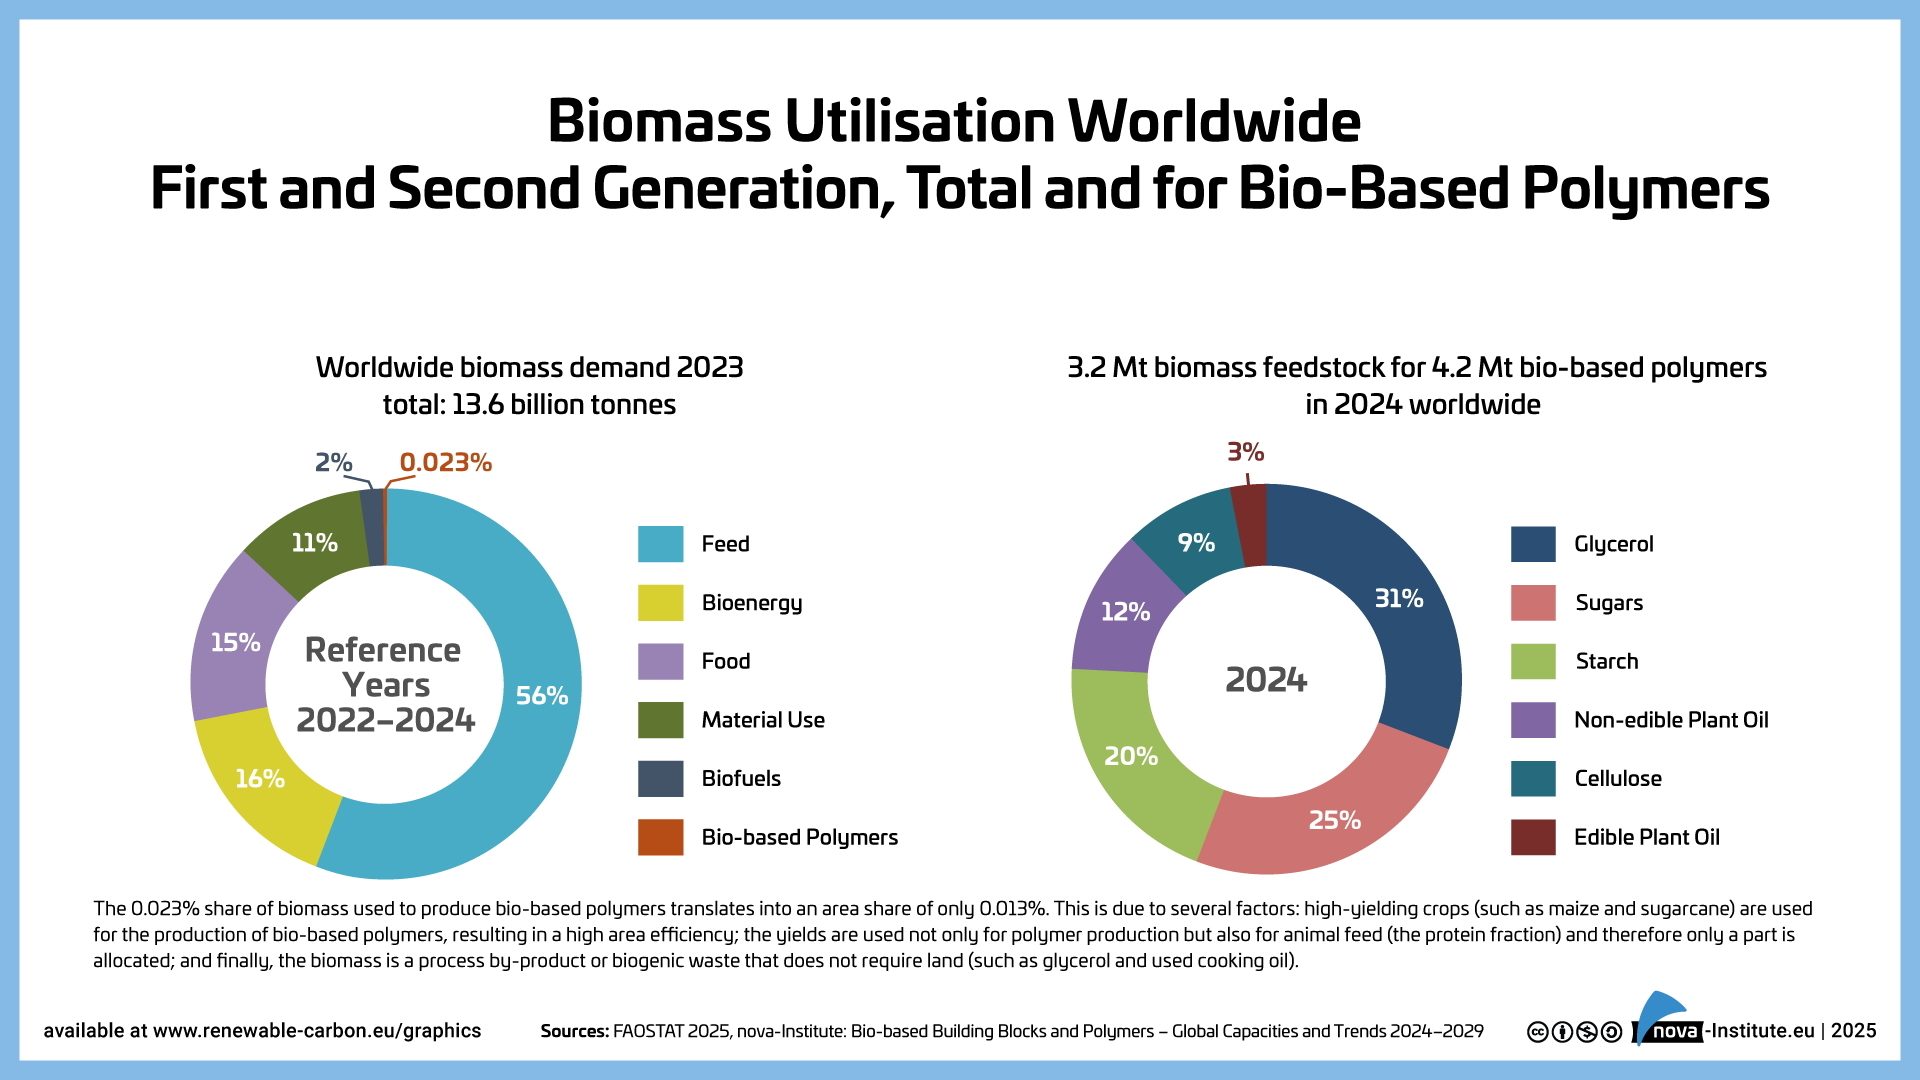
In addition, the protein content of these crops is used not only for polymer production but also for animal feed, so only the corresponding part is allocated to polymer production. Glycerol (31%), a biogenic by-product of biodiesel production, is a biomass with only an indirect, passive land use. This glycerol is mainly used in the production of epoxy resins via epichlorohydrin as an intermediate. The biomass used also included 12% from non-edible plant oils, such as castor oil, 9% from cellulose (mainly used for CA) and 3% from edible plant oil. Of the 4.2 million tonnes of biobased polymers produced (fully and partially biobased) 2.2 million tonnes were actual biobased components of the polymers (52 %), meaning that almost 1.6 times more feedstock was required than was actually incorporated into the final product. The 1.4 million tonnes (36%) of feedstock that did not end up in the product is due to the high number of conversion steps and the associated losses of feedstock and intermediates, as well as the formation of byproducts.
Global Shift to Renewable Carbon
The key market drivers in 2024 are several global brands that have adapted their strategic agendas to transition the polymers, plastics, and chemicals industry to become sustainable, climate-friendly and part of the circular economy, thus offering their customers green solutions and alternatives to petrochemical products. According to the report, the only way to achieve this successful transition is to fully replace fossil carbon with renewable carbon from alternative sources: biomass, CO2 and recycling. By expanding their feedstock portfolio to include renewable carbon in addition to fossil-based carbon, these brands are leading the way from a market perspective. In particular, the use of biomass has increased and will continue to increase the supply of biobased polymers.
Nevertheless, the market remains challenging, especially in Europe. While Asia and North America will continue to strengthen their global role in the supply of biobased polymers, Europe's market share is expected to decline by 2029. With new investments in several large-scale biobased polymer production capacities, Asia and North America are expected to increase their market share by 4% and 5%, respectively, and together they will account for more than 80% of the global supply of biobased polymers. The reports predicts that although some new large-scale plants are also planned in Europe, this will not be enough to prevent Europe's market share from falling from 13% today to 10% in 2029.
Biobased Polymers — The Highlights
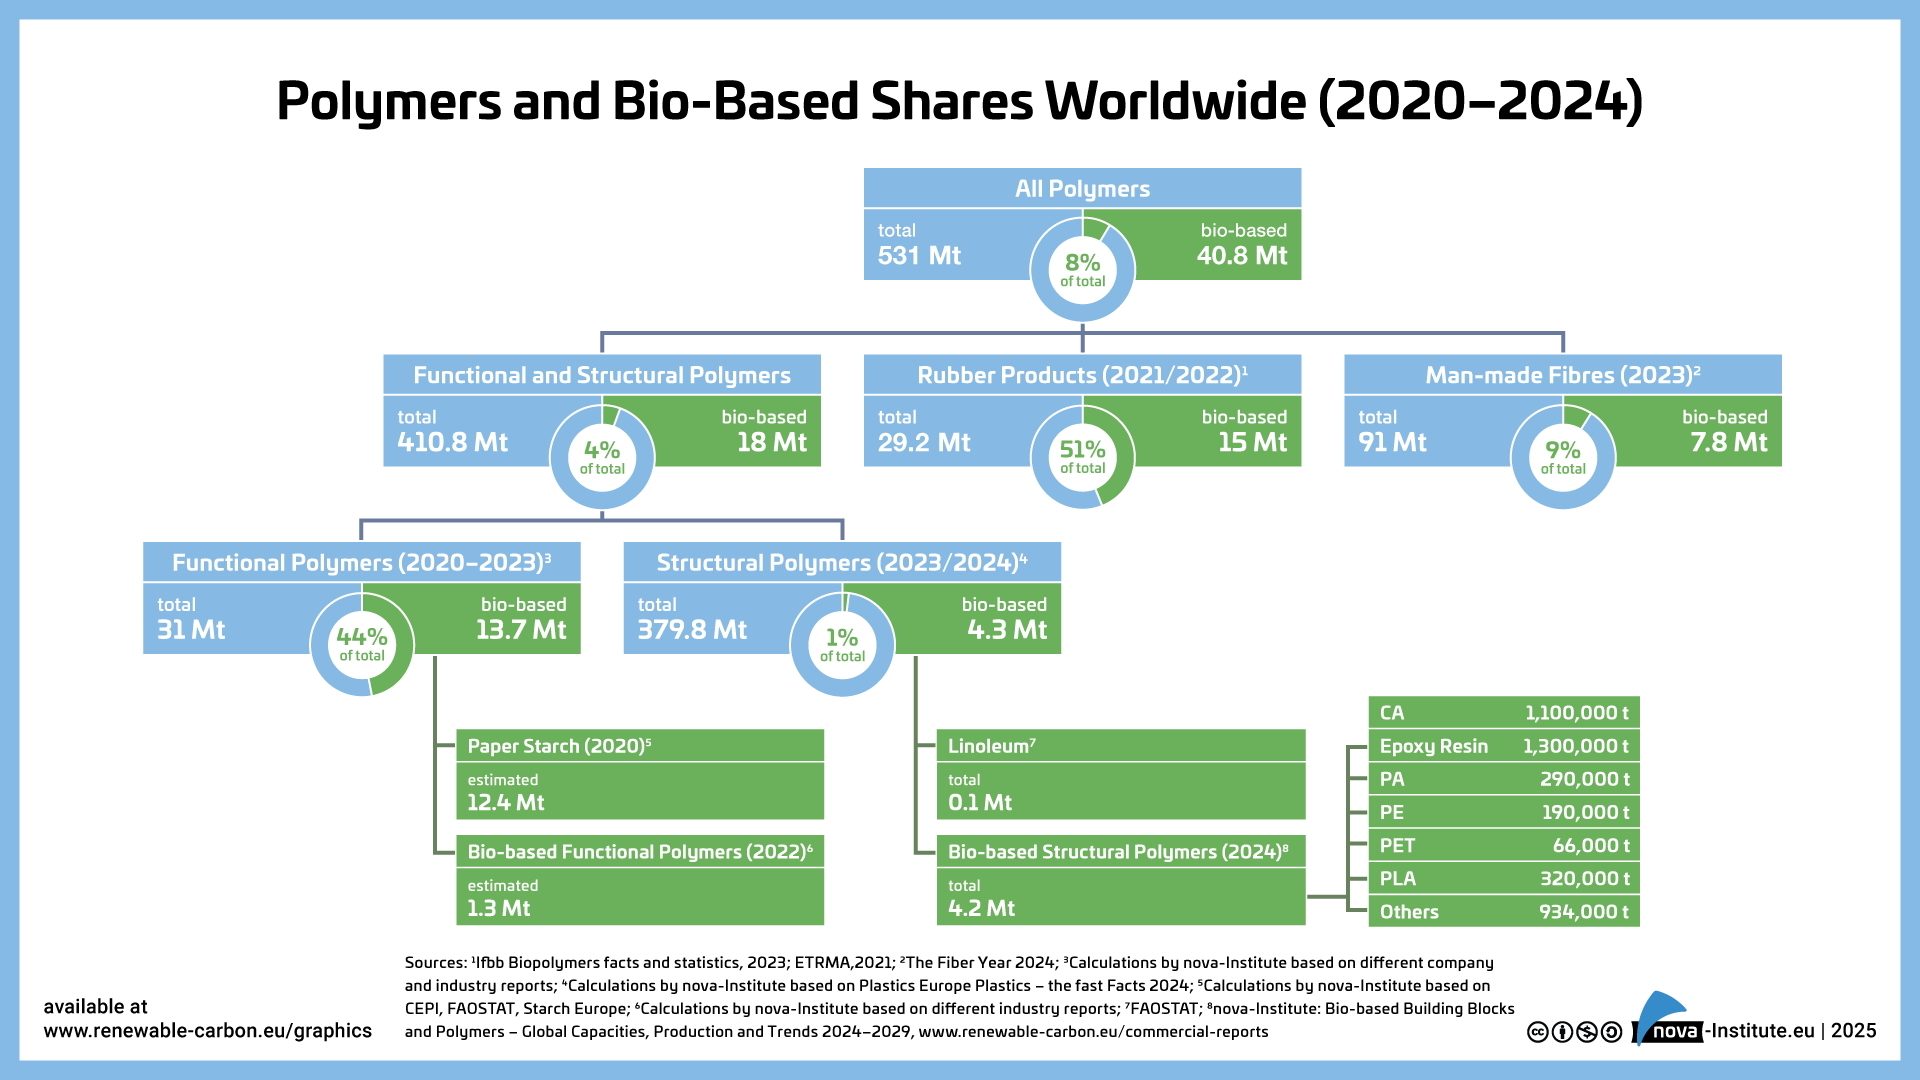
The global polymer market includes functional and structural polymers, rubber products as well as manmade fibers (Figure 3). This report focuses on the biobased share of the structural polymers. Bio based structural polymers are composed of the polymers that will later form the structural mass of the finished plastic part, which is covered in detail in this report and the biobased linoleum part. Together, they total 4.3 million tonnes. On the other hand, the total amount of bio based functional polymers consists of bio based functional polymers and paper starch, giving 13.7 million tonnes. In addition to these two groups, which account for 18 million tonnes of bio based functional and structural polymers, rubber products and man-made fibers can also be bio based. In total, 15 million tonnes of rubber products and 7.8 million tonnes of man-made fibers are made from biobased resources, 51% and 9%, respectively.
Figure 3: Polymers and biobased shares worldwide (2020–2025).
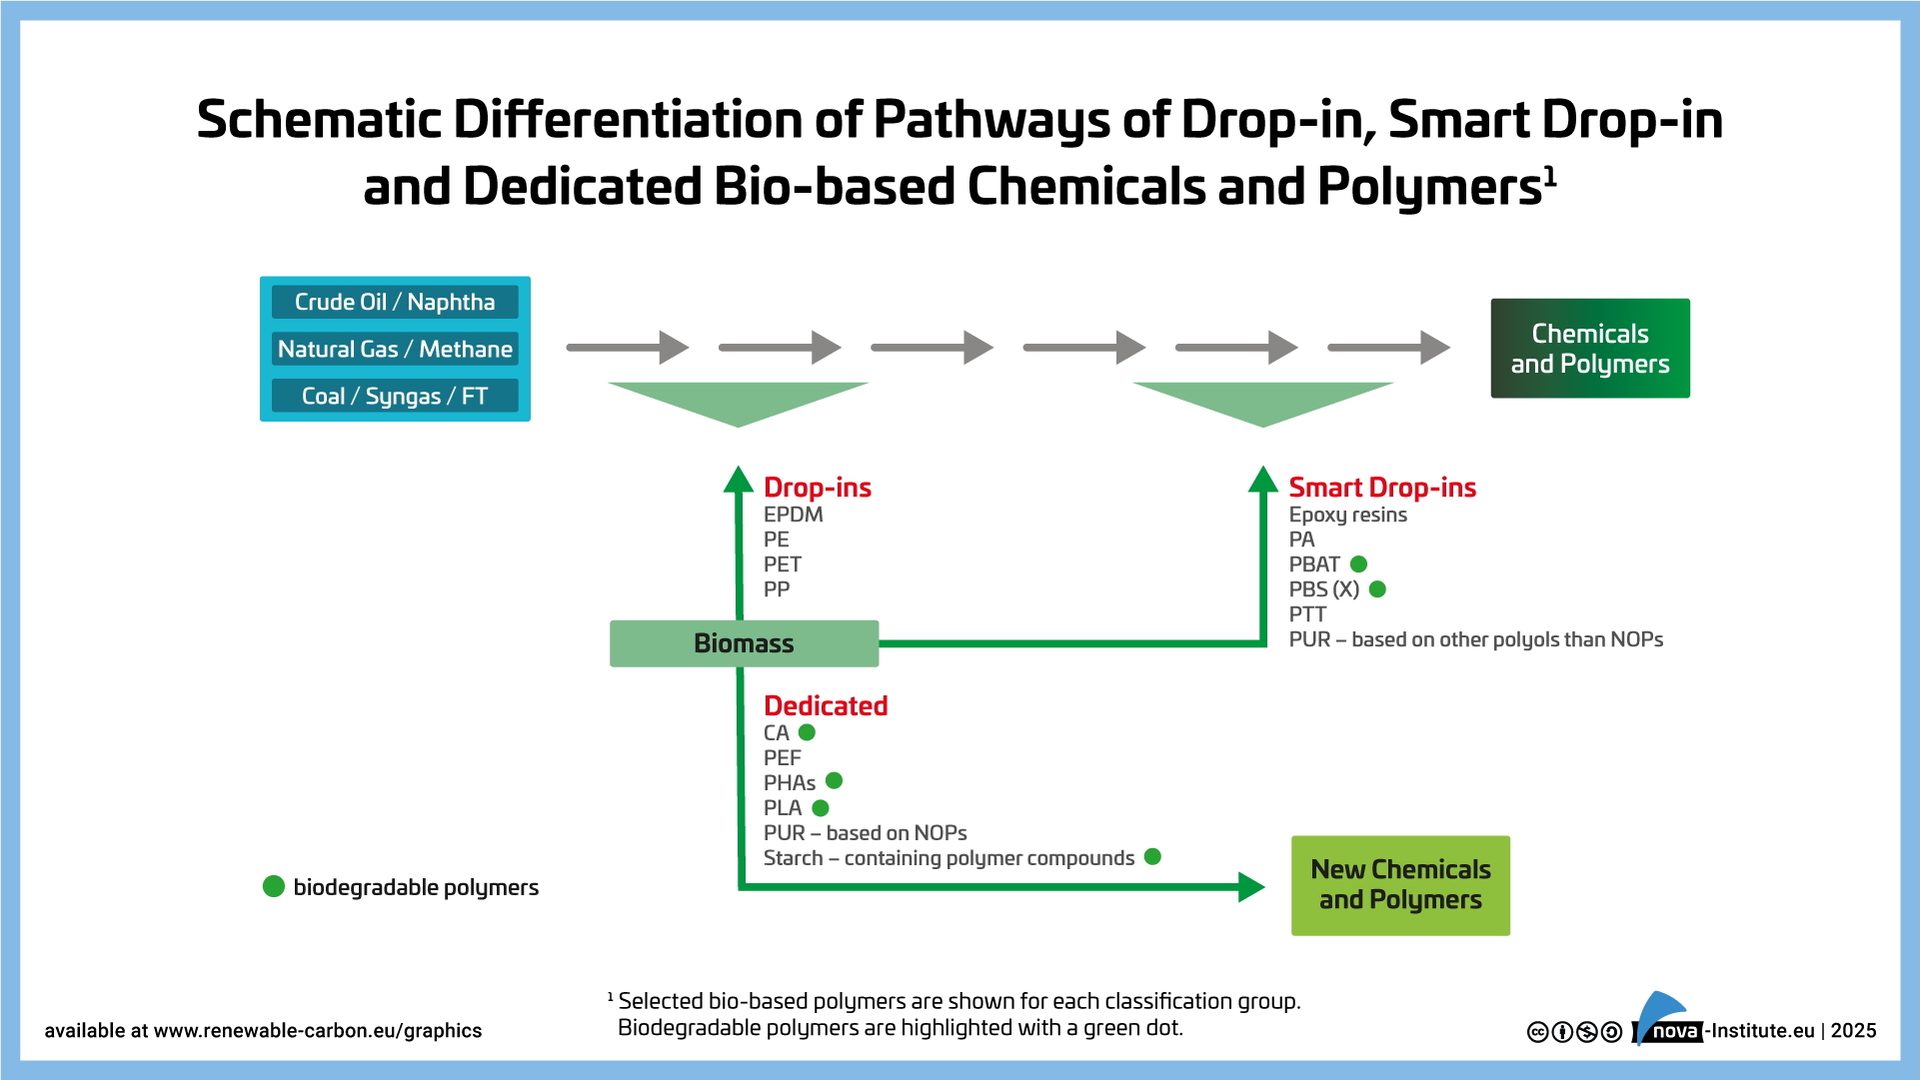
The different pathways of biobased “drop in”, “smart drop in” and “dedicated” inputs within the chemical production chain are shown in Figure 4. For each group, certain biobased polymers are presented as examples. In addition, biodegradable biobased polymers are highlighted with a green dot. The different groups of biobased polymers are subject to different market dynamics. While drop ins have direct fossil-based counterparts and can replace them, the dedicated ones have new properties and functionalities that are not available from petrochemicals. Both have their own advantages and disadvantages from a production and market perspective. While biobased drop-in chemicals are biobased versions of existing petrochemicals that have established markets and are chemically identical to existing fossil-based chemicals, smart drop in chemicals are a special sub-group of drop-in chemicals. Although they are chemically identical to existing chemicals based on fossil hydrocarbons, their biobased pathways offer significant process advantages over conventional pathways. In addition, these biobased pathways can be based on completely new approaches, such as epichlorohydrin, where the fossil feedstock propylene is not replaced by biobased propylene but by glycerol from biodiesel production. Dedicated biobased chemicals are chemicals that are commercially produced via a dedicated pathway and do not have an identical fossil-based counterpart.
Figure 4: Schematic differentiation of pathways of drop-in.
The results of the report and the development of capacities from 2018 to 2029 are based on forecasts from current and some new producers are shown in Figure 5. Total installed capacity in 2024 was 5.2 million tonnes with an actual production of 4.2 million tonnes. Capacity is expected to increase to 9.5 million tonnes in 2029, indicating an average CAGR of around 13%. The following polymers show an even higher increase, well above the average growth rate: PP, PHAs and PEF are expected to grow continuously by an average of 65% until 2029.
Figure 5: The evolution of worldwide production capacities of biobased polymers from 2018 to 2029.
Global Production Capacities by Region
Asia as the leading region in 2024, has the largest installed biobased production capacities worldwide with 59%, with the largest capacities for PLA and PA. North America had 16%, with large installed capacities for PLA and PTT and Europe had 13%, mainly based on installed capacities for SCPC and PA. South America had a share of 11% with major installations for PE and Australia / Oceania less than 1% was based on SCPC (Figure 8).
With an expected CAGR of 25% between 2024 and 2029, North America has the highest growth in biobased polymer capacities compared to other regions of the world. This increase is mainly due to expanded and new production capacities for PHA and PP.
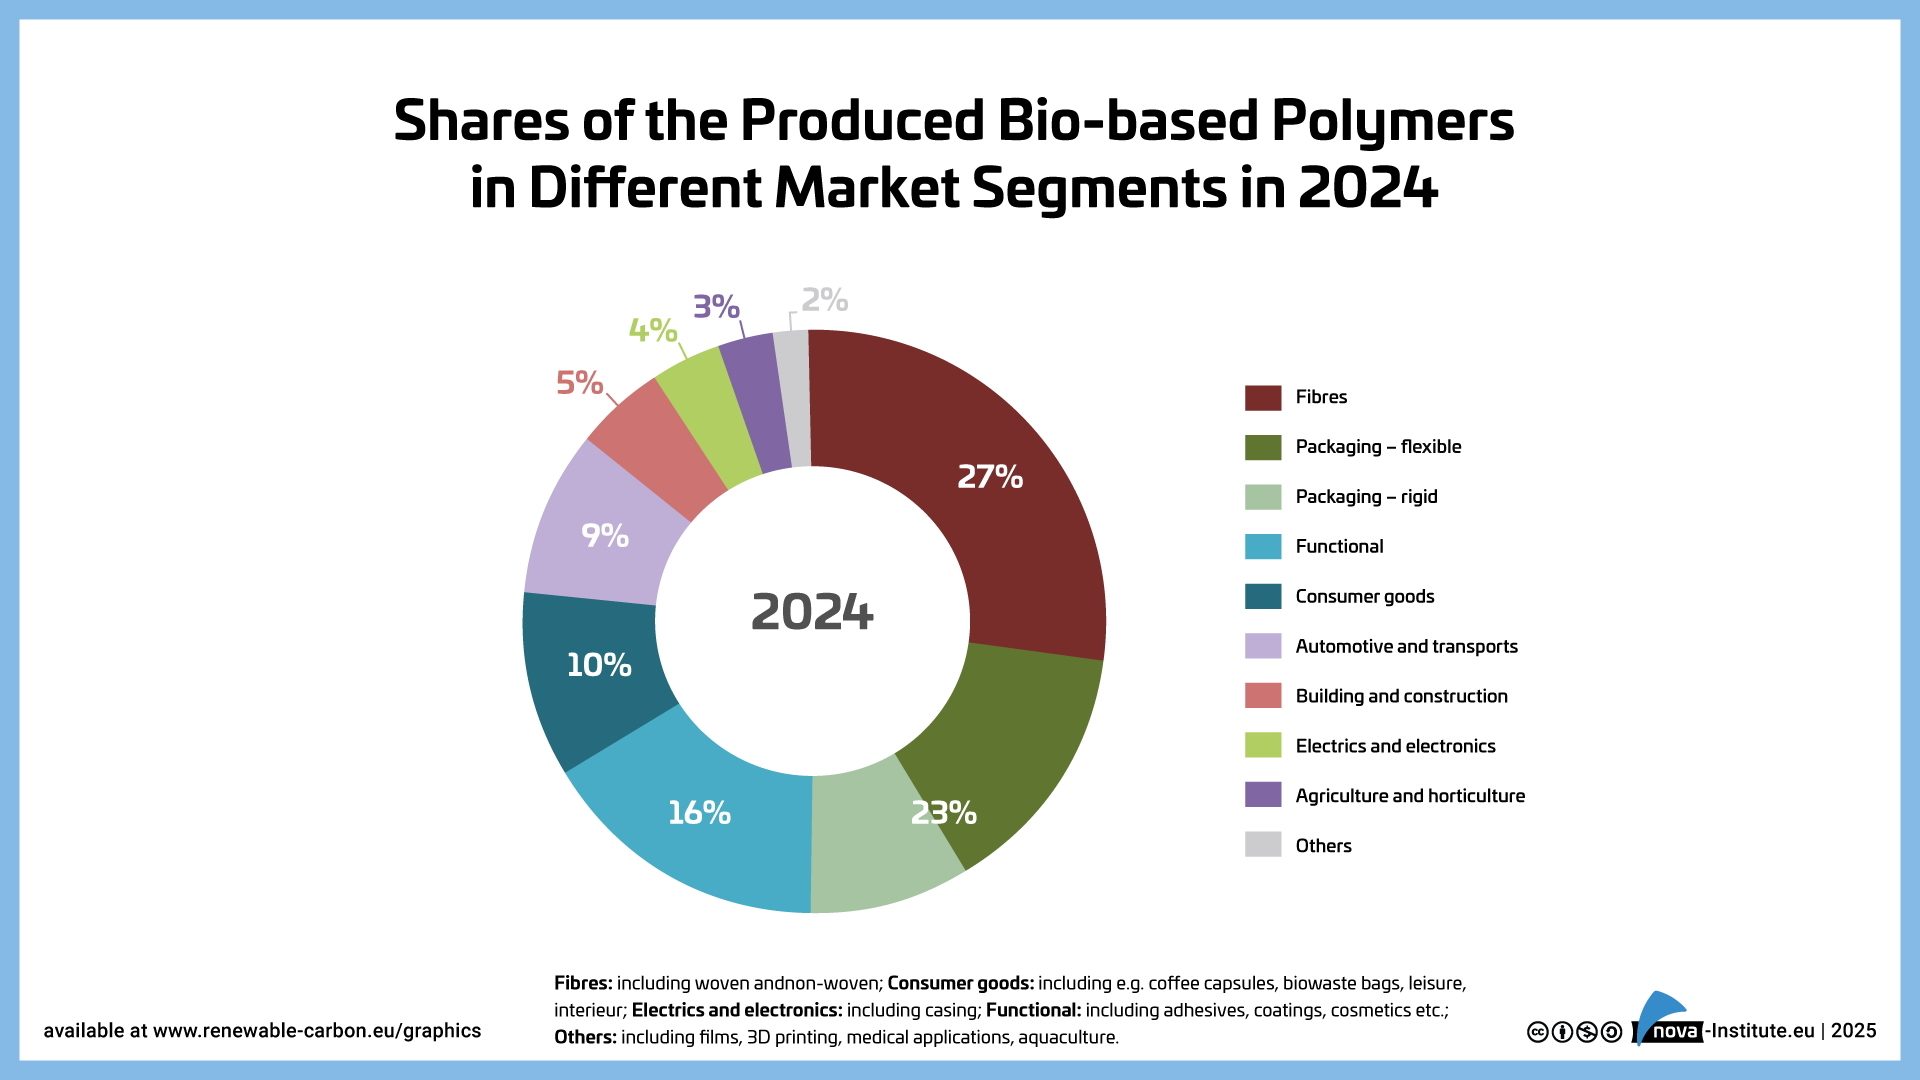
Figure 6: Shares of the produced biobased polymers in different market segments in 2024.
Market Segments for Biobased Polymers
Today, biobased polymers can be used in almost all market segments and applications, but the different applications per polymer can be very different. Figure 6 shows a summary of the applications for all biobased polymers covered in the report. In 2024 fibers including woven, non-woven (mainly CA and PTT) had the highest share with 27%. Packaging, flexible and rigid, had a total share of 23%, followed by functional applications with 16% (mainly epoxy resins and PUR), consumer goods with 10% (mainly epoxy resins, PLA and PA), and automotive and transport with 9% (mainly PUR, PA and epoxy resins). Building and construction accounted for 5% (mainly epoxy resins and PUR) and electrics and electronics for 4% (mainly epoxy resins and PA).
The report, Bio based Building Blocks and Polymers — Global Capacities, Production and Trends 2024–2029, written by the international biopolymer expert group of the nova-Institute, shows capacities and production data for 17 commercially available, biobased polymers in the year 2024 and a forecast for 2029. Learn more about the report at https://renewable-carbon.eu/commercial-reports.
To learn more about the nova-Institute, visit www.renewable-carbon.eu.
Opening image credit: greenleaf123 / iStock / Getty Images Plus. Figures within the article are provided courtesy of nova-Institute.